Economic Benefits For Indonesia
In Indonesia, palm oil is the second largest product that is produced amongst other agricultural products. In the year 2008, more than 18 million tonnes of palm oil was produced in Indonesia. Since 2003, palm oil has been Indonesia’s most common export. In the year 2008, Indonesia received about $15.3 billion Australian dollars just in palm oil exports. As of 2007, 5 million hectares has been dedicated to oil palm tree plantations, which is 10.3% of all agricultural land (48.1 million hectares). In addition to this, the Indonesian government made $1 billion dollars in 2008 on export taxes, obviously majorly paid by the largest palm oil production companies; 'Wilmar International' and 'Asian Agri'.
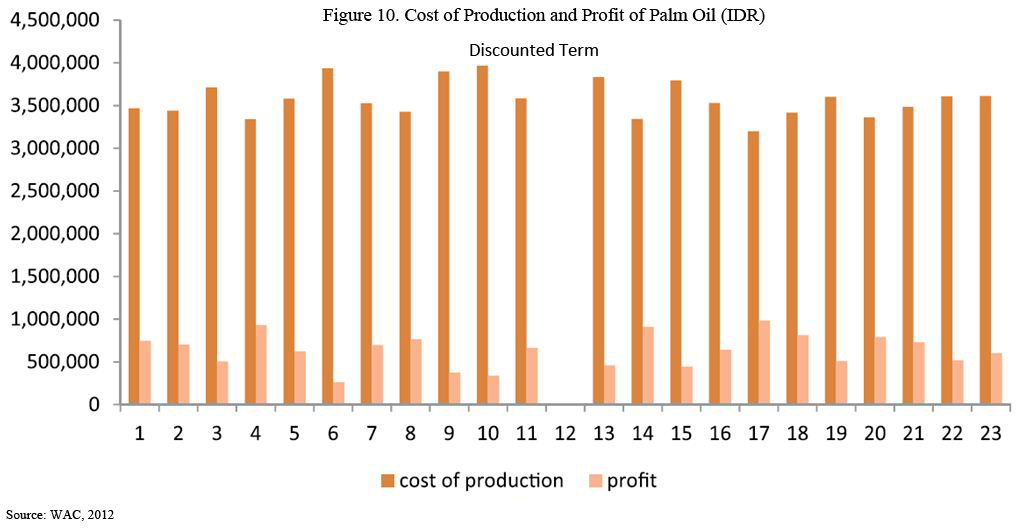
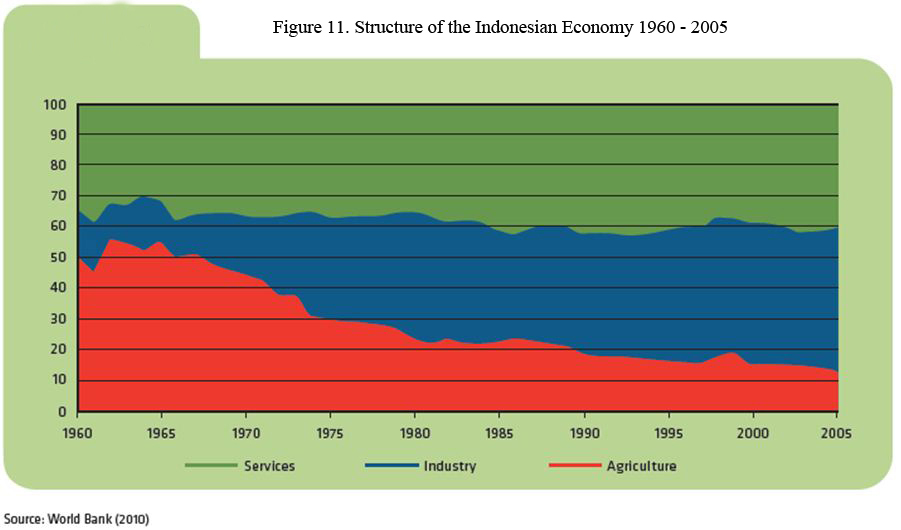
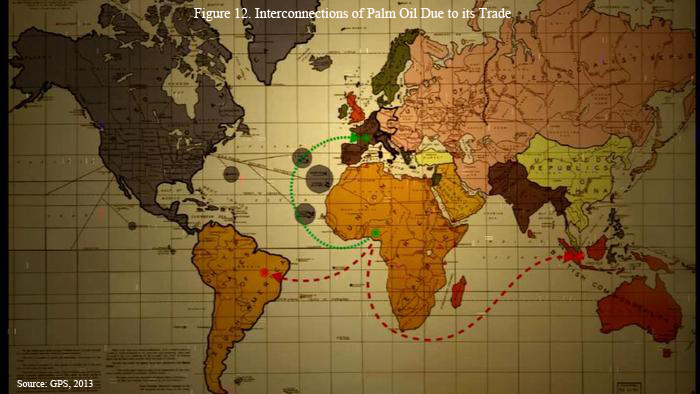
The first graph, Figure 10. Cost of Production and Profit of Palm Oil (IDR) shows that for each 'discounted term', it costs (on an average) about Rp 3,600,000 ($425 in Australian currency) to produce. This graph also shows that for each 'discounted term', that about Rp 700,000 ($70 in Australian currency) is made in profit. This demonstrates that oil palm plantation workers, palm oil producing companies and any other personnel involved in the harvesting and production of palm oil in Indonesia do not receive much money; they spend more money on the production of palm oil than they are receiving as a result of producing the product. Figure 11. Structure of the Indonesia Economy 1960 - 2005 shows that between the years 1960 and 1970, agriculture made up for a majority of the Indonesia economy. Since 1970, the services sector has maintained a consistent and an otherwise undeterred contribution to the economy, whereas agriculture has decreased dramatically and industry has increased dramatically. Something to note though, is that the industry sector could include the later stages in the supply chain of the production of palm oil. Figure 12. Interconnections of Palm Oil Due to its Trade is a rather unclear map. It essentially shows the trade of the 1600's between Europe, Africa, South America and South - East Asia. Europeans had travelled to Africa, and taken oil palm tree seeds to South America and South - East Asia. It is interesting that the oil palm trees grew far better in its 'exotic' locations that in its original location.
The first graph, Figure 10. Cost of Production and Profit of Palm Oil (IDR) shows that for each 'discounted term', it costs (on an average) about Rp 3,600,000 ($425 in Australian currency) to produce. This graph also shows that for each 'discounted term', that about Rp 700,000 ($70 in Australian currency) is made in profit. This demonstrates that oil palm plantation workers, palm oil producing companies and any other personnel involved in the harvesting and production of palm oil in Indonesia do not receive much money; they spend more money on the production of palm oil than they are receiving as a result of producing the product. Figure 11. Structure of the Indonesia Economy 1960 - 2005 shows that between the years 1960 and 1970, agriculture made up for a majority of the Indonesia economy. Since 1970, the services sector has maintained a consistent and an otherwise undeterred contribution to the economy, whereas agriculture has decreased dramatically and industry has increased dramatically. Something to note though, is that the industry sector could include the later stages in the supply chain of the production of palm oil. Figure 12. Interconnections of Palm Oil Due to its Trade is a rather unclear map. It essentially shows the trade of the 1600's between Europe, Africa, South America and South - East Asia. Europeans had travelled to Africa, and taken oil palm tree seeds to South America and South - East Asia. It is interesting that the oil palm trees grew far better in its 'exotic' locations that in its original location.